Yield loss calculator for dirty solar panels
Dust, pollen, moss and bird droppings block sunlight. Find out in 30 seconds how many kWh and euros you lose every year, and whether a cleaning pays for itself.
- Instant result in kWh and euros
- Uses your own electricity price
- Free, no sign-up
Calculate your loss
Usually 300 to 450 kWh.
Belgian average (2025).
An estimate based on average losses. Your actual loss depends on your roof, your surroundings and the type of dirt.
How the calculator works out your yield loss
No black box: the calculation is simple and you can check it yourself.
- 1
Your annual yield
The number of panels times the yield per panel, or the annual yield straight from your inverter.
- 2
The loss from dirt
Light dirt costs 8% of that yield on average, moderate dirt 12% and heavy dirt 15%.
- 3
The loss in euros
The lost kWh times your electricity price: the amount that stays on your roof every year.
The formula
Loss in euros = panels × kWh per panel × loss percentage × electricity price
Worked example
12 panels × 400 kWh = 4,800 kWh per year. With moderate dirt (12%) you lose 576 kWh. At €0.23 per kWh, that is €132.48 per year.
How much do you lose per year? Examples by installation
For installations of 10 to 40 panels, with 400 kWh per panel and an electricity price of €0.23 per kWh.
| Panels | Annual yield | Light dirt (8%) | Moderate dirt (12%) | Heavy dirt (15%) |
|---|---|---|---|---|
| 10 | 4,000 kWh | €73.60320 kWh | €110.40480 kWh | €138.00600 kWh |
| 15 | 6,000 kWh | €110.40480 kWh | €165.60720 kWh | €207.00900 kWh |
| 20 | 8,000 kWh | €147.20640 kWh | €220.80960 kWh | €276.001,200 kWh |
| 25 | 10,000 kWh | €184.00800 kWh | €276.001,200 kWh | €345.001,500 kWh |
| 30 | 12,000 kWh | €220.80960 kWh | €331.201,440 kWh | €414.001,800 kWh |
| 40 | 16,000 kWh | €294.401,280 kWh | €441.601,920 kWh | €552.002,400 kWh |
Amounts per year. The loss in kWh is shown below each amount.
How much efficiency does each type of dirt cost?
The type of dirt decides whether your loss is closer to 3% or 15%. Rain washes away loose dust, but the rest stays put.
| Type of dirt | Typical loss | What rain does |
|---|---|---|
| Dust and pollen | 2 to 5% | Partly washes away, but leaves a haze |
| Greasy grime from traffic or industry | 5 to 10% | Sticks, especially on a low tilt angle |
| Moss and lichen along the edges | 10 to 20% locally | Holds on to water and dirt and can cause hotspots |
| Bird droppings | Locally up to a whole cell | Barely helps: the stain covers the cell completely |
Measure your real loss with your inverter
The calculator uses averages. To find out what is happening on your roof, compare your own figures with a clean reference.
- 1
Note down your yield
Open your inverter's app or display and note your annual yield and the yield of a recent sunny month. Also note your installation's capacity in kWp.
- 2
Compare with a clean reference
Put those figures next to the same month last year, or next to the yield shortly after a cleaning. Using kWh per kWp, you can also compare with other installations.
- 3
Work out the difference
If you get less than 90 to 95% of your reference, dirt or a technical problem is costing you yield. If the gap is consistently more than 5%, a check is worth it.
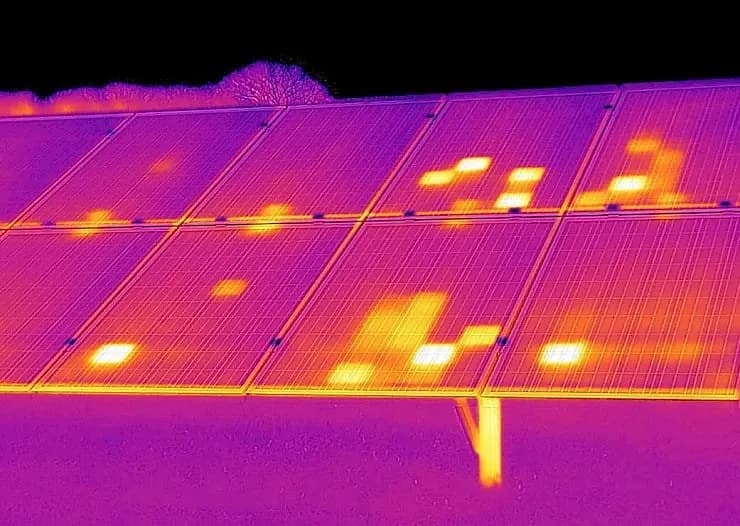
What decides how much efficiency you lose?
Two installations with the same amount of dirt can still perform differently.
- 01
Type of dirt
Fine dust costs a few percent, while a thick layer of moss or lots of bird droppings can easily cost double.
- 02
Tilt and orientation
Steep, south-facing roofs rinse clean better in the rain. Flat roofs and east-west layouts stay dirty for longer.
- 03
Surroundings
Farmland, busy roads, industry or nearby trees mean more dirt that is harder to remove.
- 04
Age and maintenance
Installations that have not been cleaned for years consistently lag behind well-maintained systems.
When is solar panel cleaning worth it?
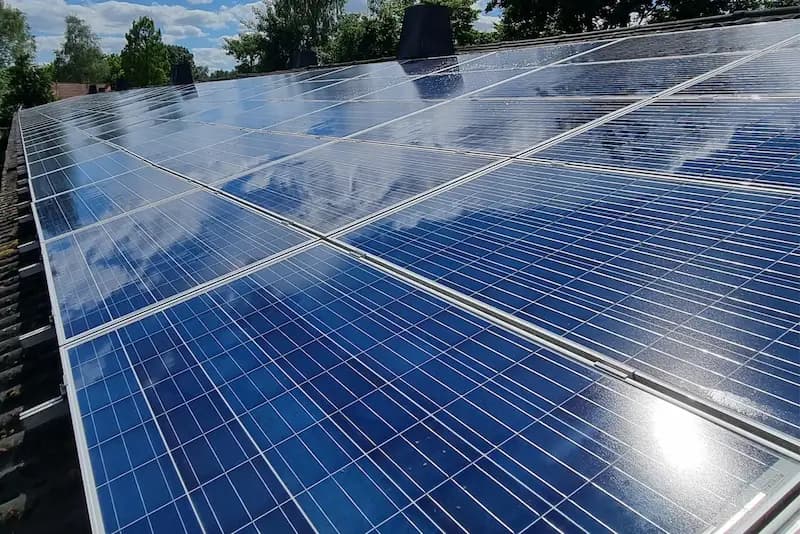
Is your yield consistently more than 5% below a clean reference, or do you see a dull haze, green growth or bird droppings? Then a professional cleaning usually pays for itself quickly. Homeowners often clean when the panels look dirty, for example after winter. For businesses and flat roofs we recommend every 1 to 2 years. Also read how often you should clean your solar panels.
Request a quote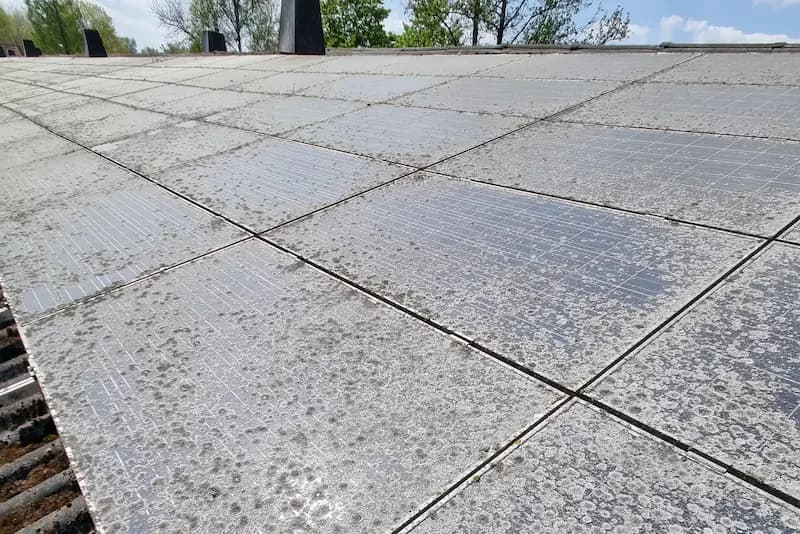 BeforeAfter
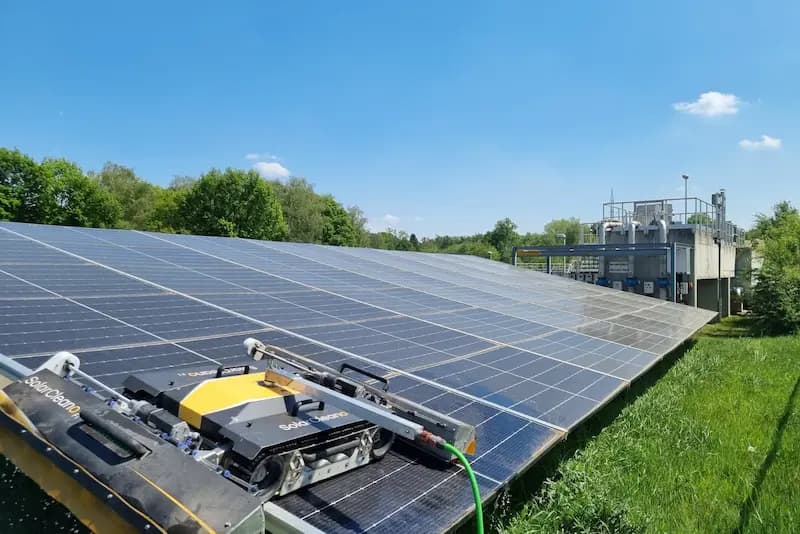 BeforeAfter
Frequently asked questions about yield loss
How much efficiency do dirty solar panels lose?
With normal dirt, usually 3 to 10%, rising to 15% for installations that have not been cleaned for years. Moss and bird droppings can cost even more locally. Read more about dirty solar panels and yield loss.
How do I know whether the loss comes from dirt or a technical problem?
Compare your inverter data with a clean reference. A gap of more than 5% often points to dirt. If you see big differences between strings, or spots that get hotter, you need a thermographic inspection.
How often should I have my solar panels cleaned?
That depends on your roof and your surroundings. Homeowners often clean when the panels look dirty, for example after winter. For businesses and flat roofs, every 1 to 2 years is a good rhythm. Your inverter data is the best signal.
Can I clean my solar panels myself?
Small, easy-to-reach installations can be cleaned yourself with pure water and a soft brush. On high, steep or flat commercial roofs we recommend a specialist: working safely and avoiding scratches come first.
Is solar panel cleaning worth it financially?
You can work that out with the calculator. For example: 10% less on 4,000 kWh is 400 kWh, or about €92 per year at €0.23 per kWh. For larger installations and heavy dirt, that adds up fast. You can read more about costs in what solar panel cleaning costs.
How accurate is the calculator?
It is an estimate based on average losses per level of dirt. For an exact figure, compare your inverter data with a clean reference or have your installation inspected.
What happens during a check by Solarco?
We carry out a visual inspection, a thermographic scan and a measurement per string, and compare the yield before and after cleaning. You get a report with photos, measurements and recommendations, plus a no-obligation quote.
Keep reading about yield and cleaning
 Tips
Dirty Solar Panels Loss of Yield: How Regular Cleaning Optimises Your Energy Output
Even thin dust cuts solar output by 5-10%. Bird droppings and pollution add up. See real data on efficiency loss and when cleaning pays for itself.
 By Hendrik Vandervoort8 min readRead more
 Tips
Improving Solar Panels Yield: How to Achieve Maximum Efficiency
What yield can you expect from solar panels in Belgium? Learn how dirt costs 5-15% efficiency and which factors affect your production.
By Hendrik Vandervoort7 min readRead more Info
How often to clean solar panels? The ultimate guide
How often should solar panels be cleaned? Frequency varies by region and installation type. Find out the optimal schedule for maximum efficiency.
By Hendrik Vandervoort3 min readRead more
Curious what a cleaning would earn you?
Request a no-obligation quote. We look at your installation and show you in black and white what it yields again after cleaning.