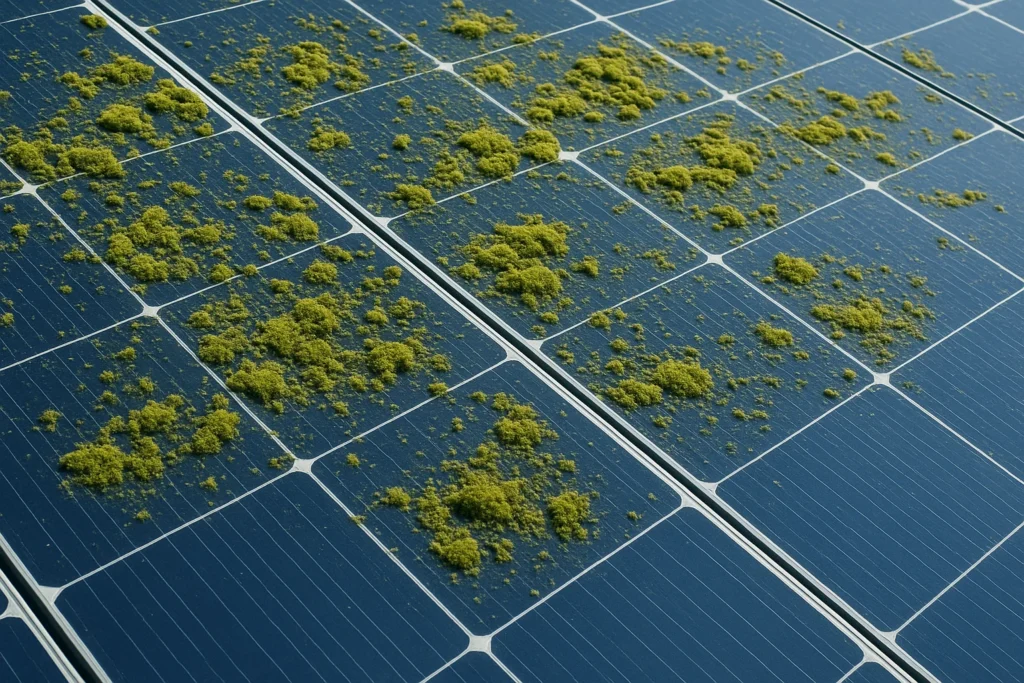
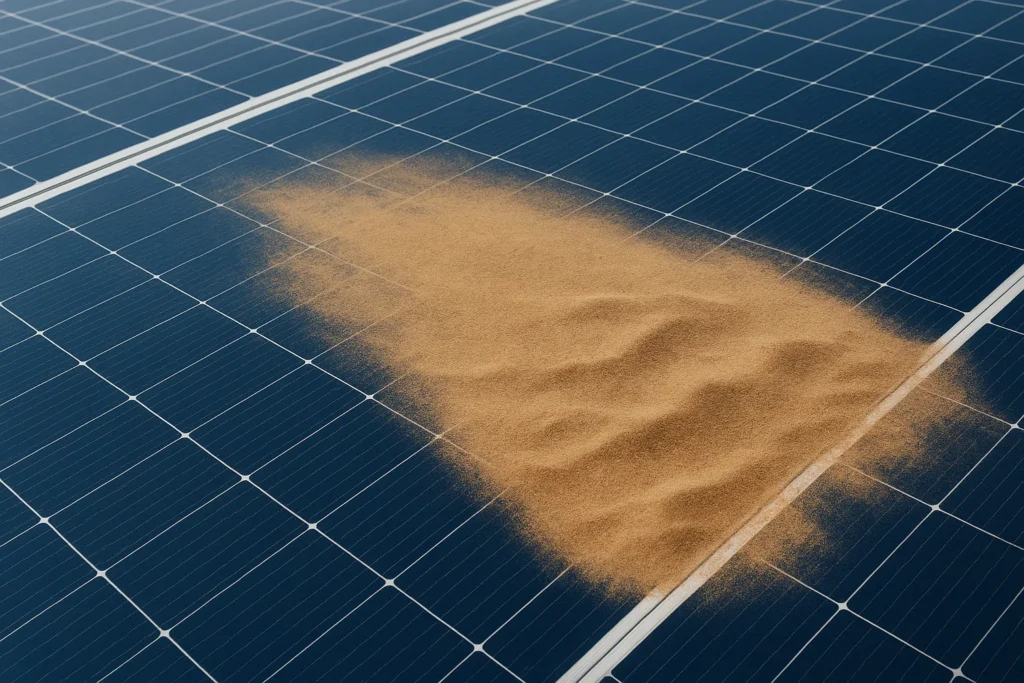
Pollution on business solar installations leads unnoticed to 5-15% yield losses. For large roofs and ground parks, this amounts to five- or six-figure sums per year. Professional cleaning yields ROIs of 150-870%, with payback periods of one to five months. In this article, three concrete calculation examples and the formula you can use to substantiate it internally.
The ROI formula: on a beer mat
The calculation a facility manager can explain to his CFO:
ROI formula solar panel cleaning
Step 1: Annual plant production (kWh) × estimated efficiency loss due to pollution (%) = kWh lost
Step 2: Lost kWh × electricity price (€/kWh) = missed revenue in euros
Step 3: Missed revenue - cleaning costs = net profit
ROI = (net profit ÷ cleaning cost) × 100%
Sounds simple - and it is. The trick is in estimating the loss of efficiency. That is why Solarco measures the effect with every intervention (more on that later). Below are three practical cases with concrete figures.
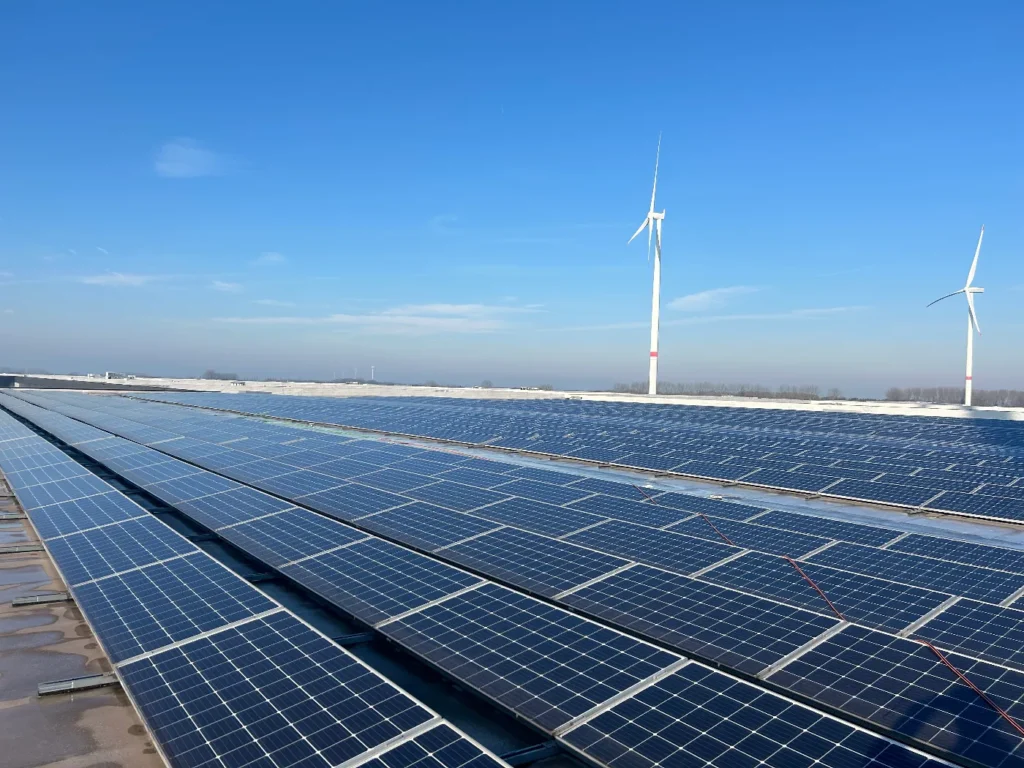
Case 1: Commercial roof: 5,000 panels
A logistics or retail company with a large flat roof and 5,000 panels (~2 MWp). The plant produces around 1,750,000 kWh per year. The energy is largely self-consumed, so the avoided purchase price is €0.20/kWh. After 2-3 years without cleaning, 10% efficiency loss is observed due to fine dust, bird droppings and industrial precipitation.
| Given | Value |
|---|---|
| Number of panels | 5.000 |
| Power | ~2 MWp |
| Annual production | 1,750,000 kWh |
| Electricity price (self-use) | €0.20/kWh |
| Efficiency loss due to pollution | 10% |
| Lost kWh per year | 175,000 kWh |
| Missed revenue per year | €35.000 |
| Cleaning fee (roof, €0.90/panel) | €4,500 per turn |
| Frequency | once a year |
Result: commercial roof
Missed revenue: €35,000/year
Cleaning costs: €4,500/year
Net profit: €30,500/year
ROI: 678% - Payback period: <1 month
Turnaround time cleaning: ~2.5 working days (SolarCleano F1, ~2,000 panels/day)
With self-consumption, the ROI is highest because you save the full retail price of power instead of a lower injection or PPA rate. This makes commercial roofs the most cost-effective category for professional cleaning.
Case 2: Ground park: 10,000 panels
A solar farm near farmland with 10,000 panels (~4 MWp). Heavy pollution pressure due to ammonia, dust and bird droppings. After one and a half years without cleaning, 12% efficiency loss is observed. Energy is sold through a PPA contract at €0.08/kWh.
| Given | Value |
|---|---|
| Number of panels | 10.000 |
| Power | ~4 MWp |
| Annual production | 3,500,000 kWh |
| Power price (PPA) | €0.08/kWh |
| Efficiency loss due to pollution | 12% |
| Lost kWh per year | 420,000 kWh |
| Missed revenue per year | €33.600 |
| Cleaning fee (ground, €0.50/panel) | €5,000 per turn |
| Frequency | twice a year |
Result: land park
Missed revenue: €33,600/year
Cleaning costs: €10,000/year (2 turns)
Net profit: €23,600/year
ROI: 236% - Payback period: ~4 months
Turnaround time per turn: ~2 working days (SolarCleano L1, ~5,000-6,000 panels/day)
The ROI for land-based farms is lower than for commercial rooftops because the power price (PPA/injection) is lower than self-consumption. But the absolute amount is greater - and with a higher PPA price, the ROI rises rapidly towards 300%+.
Case 3: SME roof: 200 panels
A smaller SME with 200 panels (~80 kWp) on a commercial pitched roof. The installation produces around 70,000 kWh per year, mostly self-consumption at €0.28/kWh. After 2 years, 8% yield loss is visible.
| Given | Value |
|---|---|
| Number of panels | 200 |
| Power | ~80 kWp |
| Annual production | 70,000 kWh |
| Electricity price (self-use) | €0.28/kWh |
| Efficiency loss due to pollution | 8% |
| Lost kWh per year | 5,600 kWh |
| Missed revenue per year | €1.568 |
| Cleaning fee (commercial, €2/panel) | €400 per turn |
| Frequency | once a year |
Result: SME roof
Missed revenue: €1,568/year
Cleaning costs: €400/year
Net profit: €1,168/year
ROI: 292% - Payback period: ~3 months
This example shows that even with a relatively small business installation, the ROI is broadly positive. The threshold is low (€400), the profit concrete (€1,168), and the risk of damage or warranty loss is eliminated at the same time.
Calculate the ROI for your installation - request a quote
What companies forget in ROI calculation
The cases above calculate only with direct kWh gains. In reality, the total added value is greater:
- Hotspot detection prevents costly damage: During every cleaning, Solarco carries out a visual inspection. One undiscovered hot spot can permanently damage a panel. Replacement cost: €150-€300 per panel + labour. Early detection prevents this.
- Warranty retention: Manufacturers require proof of professional maintenance for warranty claims. Solarco provides a report with before/after photos with every intervention. Without documentation: no claim.
- Delayed degradation: Solar panels degrade ~0.5-0.7% per year. Dirt, moss and chemical precipitation accelerate this. Regular cleaning keeps degradation at the natural minimum. Over 25 years, this makes thousands of euros difference.
- Higher asset value: A plant with documented maintenance history is worth more when sold, refinanced or due diligence. Banks and investors explicitly ask for this.
- Compliance and PPA contracts: Some off-take contracts and subsidy structures require minimum performance standards. Loss of performance due to neglect can lead to penalties or breach of contract.
How Solarco proves efficiency recovery
Whereas most cleaning companies work with generic claims (“up to 25% more efficiency”), Solarco measures the actual effect with each intervention.
Method 1: Reference inverter: We clean the entire park but deliberately leave one inverter dirty as a reference. In the monitoring software, the difference in production is immediately visible - irrefutable evidence you can present to management, financiers and auditors.
Method 2: Before/after monitoring: Together with your installer or monitoring partner, we measure the production before and after cleaning at comparable solar irradiation. The difference is incorporated into a report with before/after curves and the percentage yield recovery.
Both methods provide hard data, useful for internal reporting, ESG audits, guarantee files and investment decisions.
When is ROI negative?
Honesty comes with the territory. Professional cleaning is not always worth it:
- Small residential pitched roofs (8-15 panels) in a clean environment: 12 panels × 400 kWh × 5% loss × €0.25 = €60/year loss. This is less than the cleaning cost of €125. In this case, rain and possibly careful self-cleaning will suffice.
- Installations with severe physical damage: With hail damage, delamination or broken cells, cleaning hardly provides any additional yield. Repair first, then draw up a maintenance plan.
However, for almost all commercial and industrial plants, the ROI is largely positive, as the three cases above show.
Frequently asked questions
How often should commercial solar panels be professionally cleaned?
It depends on environment and monitoring data. Industrial roofs and installations near agriculture: 1-3× per year. Office sites in clean environments: 1× per year or every two years. Let cleaning frequency be driven by production anomalies in your monitoring.
What does professional cleaning for large installations cost?
Solarco works with volume tariffs: ground installations from €0.40/panel, large roofs from €0.60/panel. For commercial installations applies €2/panel, for industrial facilities €1.50/panel. Exact price after site analysis.
How does Solarco prove yield recovery?
Via the reference inverter method (deliberately leaving one inverter dirty as a benchmark) or via before/after measurements in the monitoring software at comparable solar irradiance. Both provide measurable, documentable results.
Does cleaning protect my guarantees?
Yes. Manufacturers often require proof of professional maintenance in warranty claims. Solarco provides a report with photos and findings with every intervention - immediately usable as substantiation.
How quickly can Solarco clean my installation?
On ground installations: 5,000-6,000 panels per day (SolarCleano L1). On rooftops: ~2,000 panels per day (SolarCleano F1). A commercial roof of 5,000 panels is ready in 2.5 working days.
Want to calculate the ROI for your installation?
Get an initial estimate with our free yield loss calculator, or request a no-obligation quote directly. Within 48 hours, you will receive a clear proposal with expected efficiency gains and costs tailored to your installation.
Request a no-obligation quote